How to change bound column in widget dynamically in view mode
Published:
The Bold BI application supports the option to change the bound columns in the widget dynamically. By using the expression column and dashboard parameters, we can achieve this feature. We can do this by:
- Creating dashboard parameters with column names.
- Creating an expression column to switch the column names.
- Configuring the widget with dynamic columns.
Use Case
In the example below, the feature is applicable when the user wants to visualize the total marks of the students in Quarterly, Half-yearly, and Annual exams dynamically in a single widget. Users can select the terms and showcase the marks in a widget.Creating dashboard parameters with column names
We can add the column names to the dashboard parameter to change them dynamically in view mode.Follow the steps below to achieve this requirement:
- Select list mode in the dashboard parameter configuration page.

Dashboard Parameter configuration - Select the Value as Manual and add the column values on the text box then click Add.

Dashboard Parameter configuration - Add the dashboard parameter as shown in the image below

Dashboard Parameter configuration - Enable set first value or choose a default value from the drop down as shown in the image below then save and close.
NOTE: The user can add one or more values manually when updating the parameters.
Creating expression column to switch the column names
We create the expression column with the parameter columns to switch the column values. Follow the steps below to achieve this:- Create an expression column for the dynamic measure as follows.

Expression column creation
NOTE: More details about How to create different If condition-based expressions in Bold BI is explained on this link.
Configuring widgets to view the dynamic columns
We configure the parameters on the combo chart to filter the dynamic measure values that are configured on the column chart. Follow the steps below to achieve this:NOTE: For proper visualization and compatibility, the widgets are configured in a combine widget as follows:
- Drag and drop the combo box and the column chart on the combine widget as shown below:

- Configure the parameter on the combo box widget as shown below:

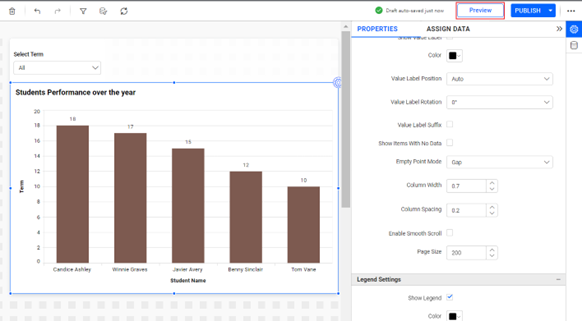
Combo box configuration - Configure a column chart with the value and the expression column as shown below:

Column chart configuration - Click Preview to view the dynamic column changes in widget.
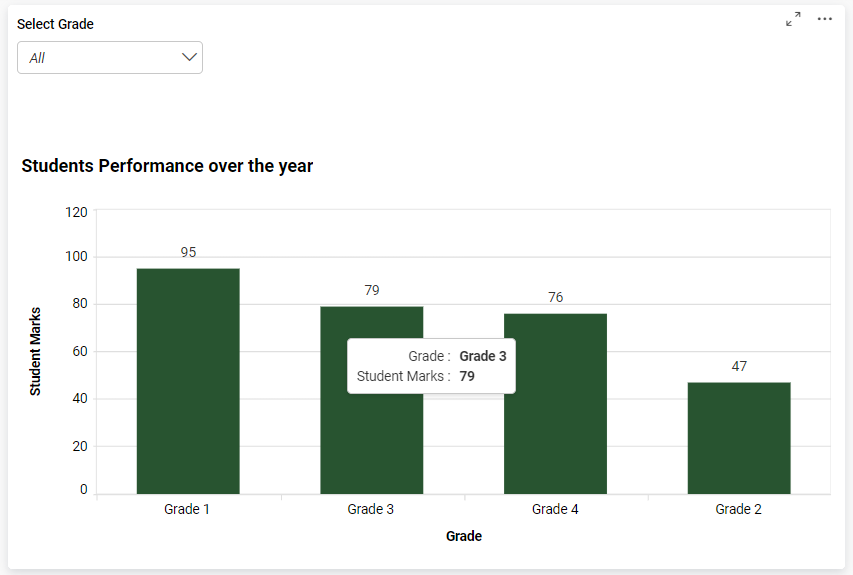
Click to Preview - Select any column name to view the dynamic measure on the column chart.

Widget Filter - Select any other value from the term to view the respective mark details.

Widget Filter - We can also apply dynamic column changes on the dimension as shown below:
Dimension Dynamic changes
Related links
EO

