How to predict future results with different forecasting models?
Forecasting - BoldBI
Forecasting is the process of predicting future data based on past and present data. In the Bold BI application, the Forecasting feature has been implemented and the predicted data can be visualized in the Line chart widget. The technique that is used for forecasting the future data in the Bold BI is Exponential Smoothing. Before applying the forecasting techniques, Bold BI classifies the input data under two categories either Seasonal or Non-seasonal data. Depending upon the category of input data, the forecasting models will be applied.What is Seasonal data and Non-Seasonal data?
Seasonal data refers to time-series data that experiences regular and predictable changes that recur over a period of time. Data fluctuations will occur periodically and will be cyclic over a period of time. Bold BI uses the Triple Exponential smoothing model to predict future data for Seasonal historical data.Non-Seasonal data refers to data that does not fluctuate cyclically. Here, the data transmissions might be in a trend or univariate manner. Trend data has constant growth or downfall stripes over a period of time, Whereas the Univariate data does not have any constant fluctuations, and data variations were irrespective of any periodicity. Before predicting the Non-Seasonal data, Bold BI classifies the input data as either Trend or Univariate type and applies the forecasting model. For Trend and Univariate type input data, the Double Exponential smoothing and Single Exponential smoothing techniques were applied respectively.
Enabling Forecast in Bold BI dashboards
In Bold BI, the forecast option is available only in the Line chart widget. After assigning the Column and Value field in a Line chart, the forecast option can be enabled as shown in the following image,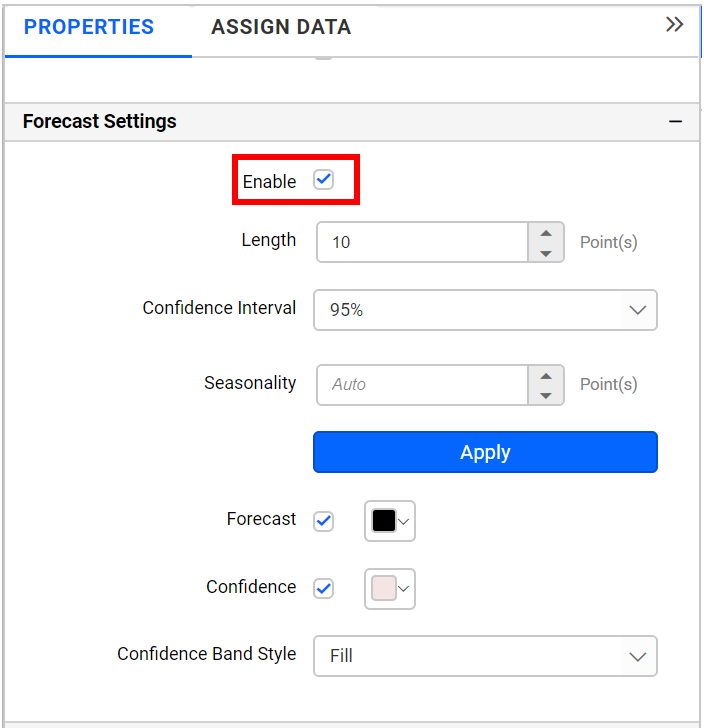
Bold BI uses the Exponential smoothing technique for forecasting features. Exponential smoothing is a widely used forecasting technique for time series data and predictions would be accurate for seasonally fluctuated data.
About Exponential Smoothing
Exponential smoothing is a time series forecasting method for univariate data that can be extended to support data with a systematic trend or seasonal component. Exponential smoothing methods are the weighted average of past observation with the weights decaying exponentially as the observations get older that is more recent the observation, the higher the associated weights.The exponential smoothing technique uses alpha, beta, and gamma values for prediction, and the forecasting output may vary based on these values. Bold BI uses an error prediction technique to choose the best alpha, beta, and gamma values to produce better forecasting results.
Classifications in Exponential smoothing
Exponential smoothing has been classified into three models and is used based on historical data.- Simple exponential smoothing
- Double exponential smoothing
- Triple exponential smoothing
How Bold BI chooses best Exponential model?
Bold BI automatically predicts the best suiting model among the three, based on the given input data, and to auto predict the type of input data, the auto-correlation technique is used.Bold BI predicts a set of correlation values for the given input data and chooses the best Exponential model to apply based on the following conditions,
- If the first index value is higher than the set of correlation values then the data will be considered as trend data and for trend data double exponential smoothing technique will be applied to predict the future data.
- If the highest correlation value is present at the mid position then, the data is considered as seasonal data and for seasonal data triple exponential smoothing technique will be applied for forecasting.
- If none of the above conditions are satisfied then, the data will be considered univariate, and the Single Exponential smoothing technique will be applied.
Enabling Seasonal forecasting in Bold BI
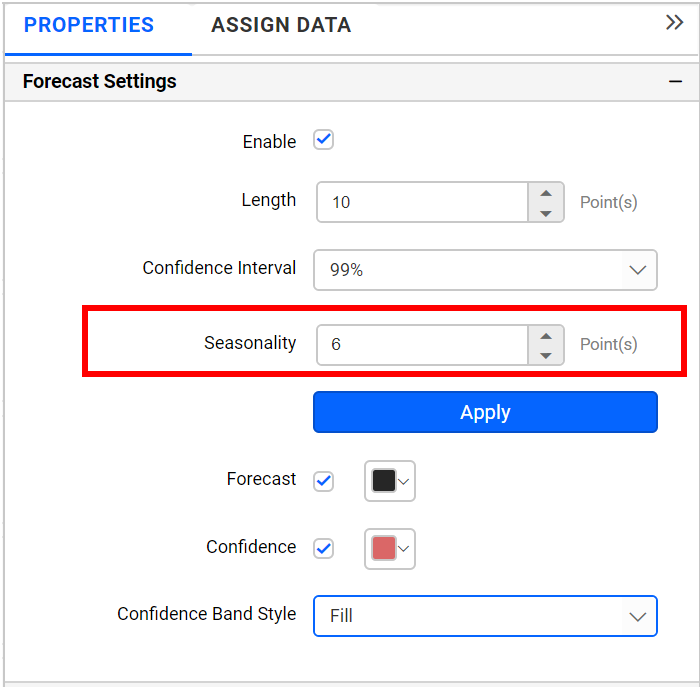
Instead of auto predicting the forecasting model, Seasonal forecasting can be enforced for any given input data by using the Seasonality property in the Bold BI Forecast Settings.In the following image, the Seasonality value has been set as 6, hence without applying any auto prediction formulas, Bold BI will consider the given input data as seasonal data format and will apply the Triple Exponential forecasting technique for prediction.
Seasonality value can be set, only if familiar with the type of input data is seasonal and knowing of its exact seasonal value else seasonality property can remain unset so that Bold BI will apply the best forecasting technique using the auto-correlation technique.
Bold BI Forecasting for univariate data
- A simple exponential smoothing model is a time series forecasting technique for univariate data that does not contain any trend or seasonal fluctuations.
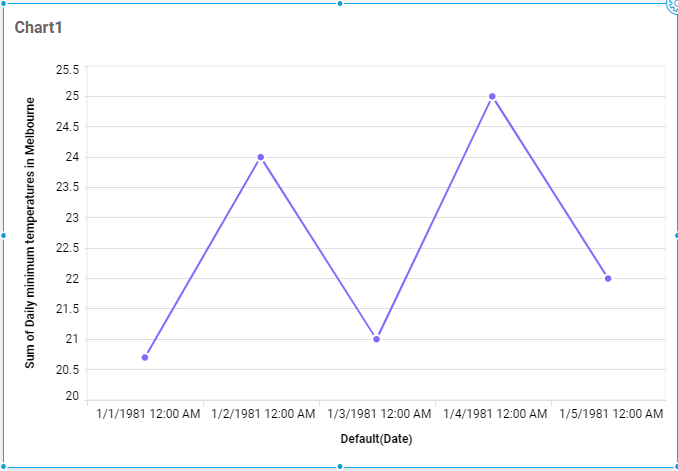
- The following image is an example of how univariate data looks,
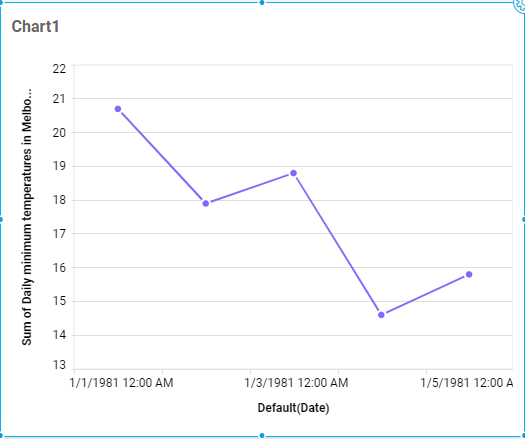
- Bold BI predicts a single smoothing factor or smoothing coefficient called alpha (α) for forecasting the univariate data.
- The alpha value ranges from 0 to 1.
- If the alpha value is close to 1 then, the most recent data will influence the forecast, whereas a value close to 0 will influence the older data for forecasting, and based on this forecasting output may differ.
Bold BI forecasting for Trend data
- Double exponential is an extension of simple exponential smoothing that adds support to forecast the trend data.
- Trend data has a constant growth over a period of time.
- The following image showcases how a trend data looks,
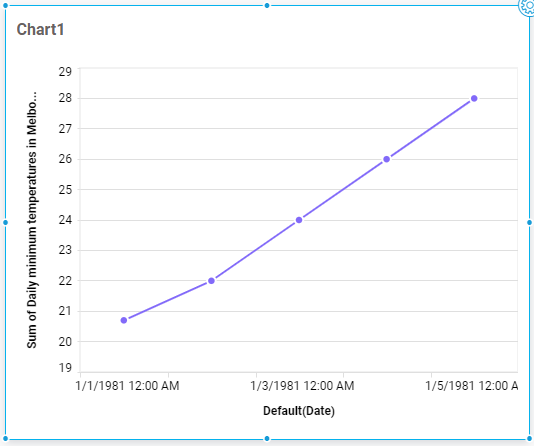
- For Double exponential, Bold BI predicts the alpha and beta values for prediction. Here, the alpha (α) parameter will be considered to influence the smoothing of level and the beta (β) parameter to influence the smoothing of a trend.
- Both alpha and beta values range from 0 to 1 and based on the closest value either towards 0 or 1, the trend data differs.
Bold BI forecasting for seasonal cyclic data
- Triple exponential smoothing is used to forecast time series data having seasonal fluctuations.
- The following image showcases seasonal data,
- For triple exponential smoothing, Bold BI uses the third equation for seasonality in addition to the existing two equations.
- Uses alpha (α) constant to influence the smoothing of level and beta (β) constant to influence the smoothing of a trend, and gamma (γ) constant to influence the seasonality.
- Bold BI matches with the combinations of constant values and chooses the best forecast output by predicting the error value.
- A combination of alpha, beta, and gamma values having a lease error predicted value will be considered for forecasting the seasonal data.

