How to increase line thickness in chart
Published:
In Bold BI, the option to adjust the line width is available on spline and line charts. Therefore, we can configure a line chart with two measures and change the series type to column and line. Then we can customize the line width. It will also serve the same purpose as a combination chart.
This process can be executed as shown below:
- Configure a column chart with the measures as shown below:
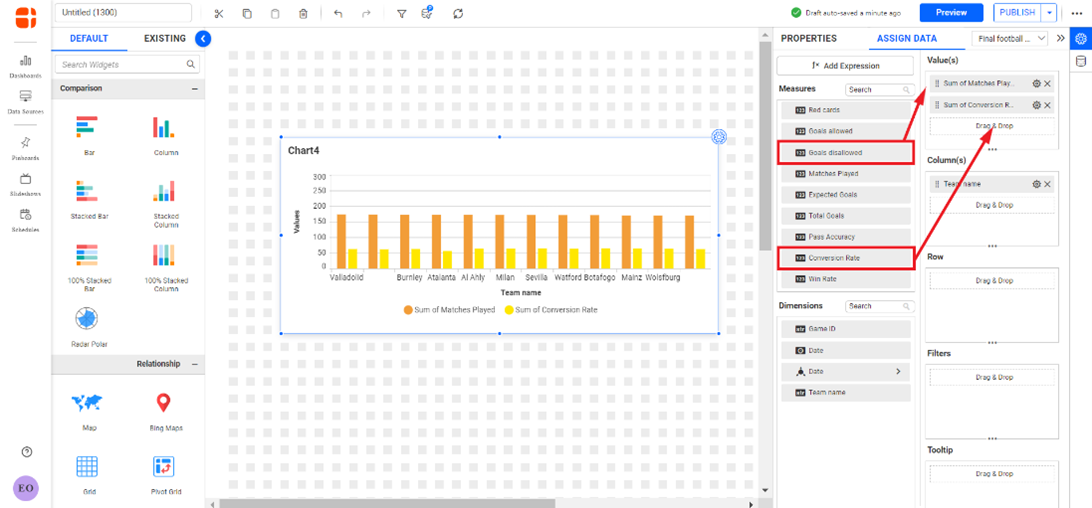
Dashboard Designer Page - Click on the properties tab to navigate to the settings and customize the widget.
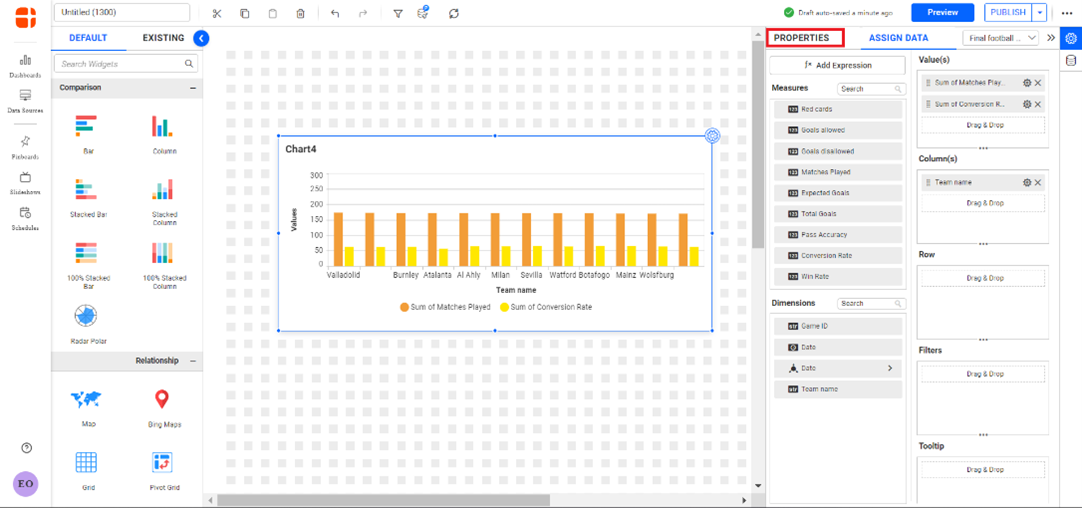
Dashboard Designer Page - Click the change button in the Chart Type and Axis under the properties pane, then a Chart Type & Axis Settings pane pops up.
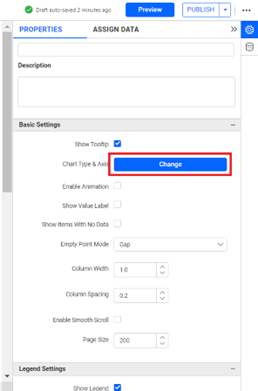
Chart properties section 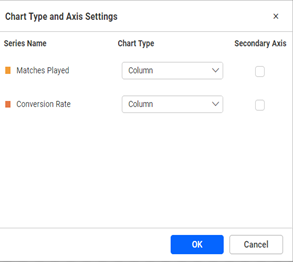
Chart Type and Axis Settings - Change the column axis type to line and enable the secondary axis option on the check box, then click OK.
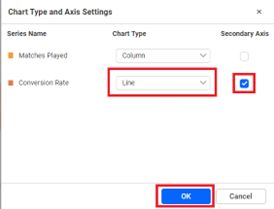
Chart Type and Axis Settings 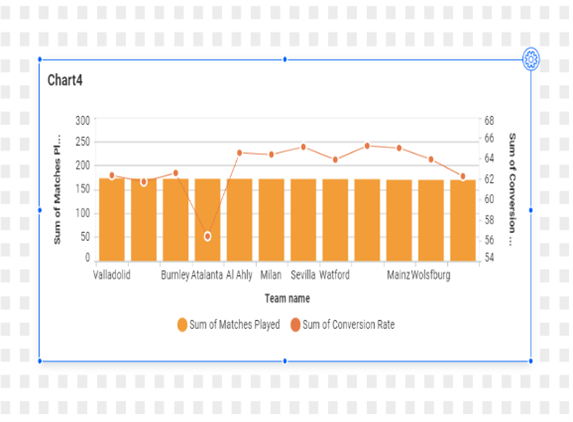
Changed chart type - Change the line width by inserting the intended value in the numerical text box.
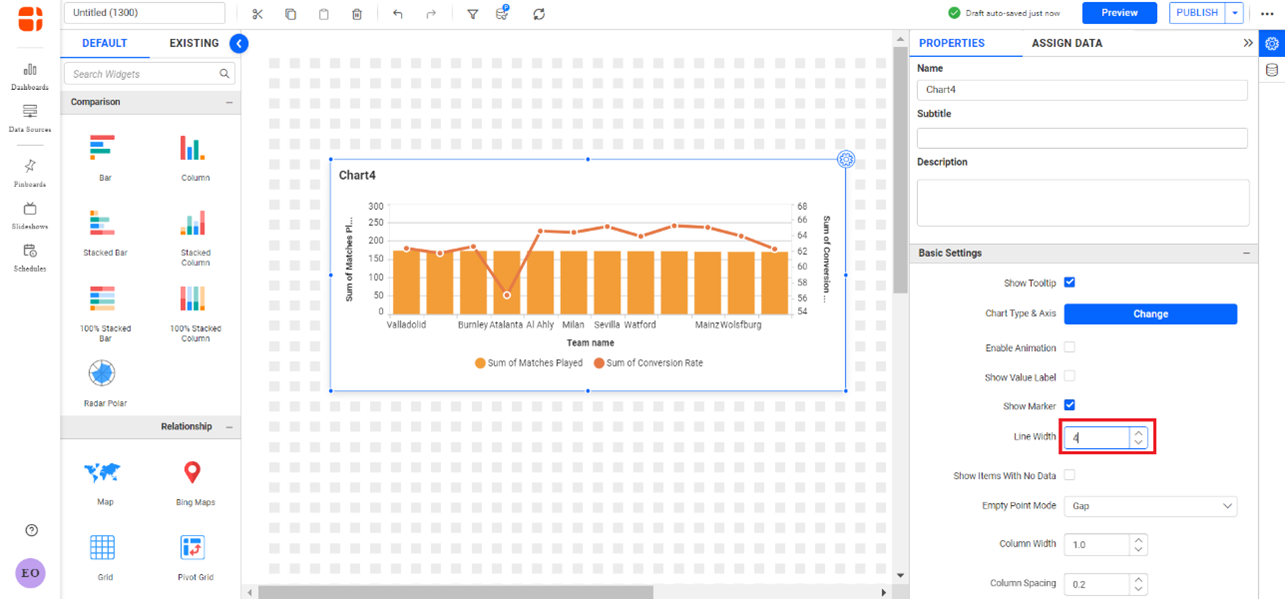
Changed line width of Chart widget
RN

