Enable Hierarchical Drill Down and Up in Bold BI Widget Visuals
Published:
Bold BI supports analyzing hierarchical data. Users can view hierarchical data in the widgets by doing a drill down or drill up on the specific value.
Enable hierarchical drill down or drill up in widgets in Bold BI
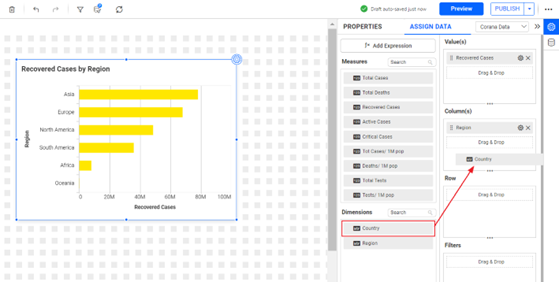
Please follow the steps to enable hierarchical drill down or drill up in the chart widget below:- Drag and drop the column hierarchies in the columns section.
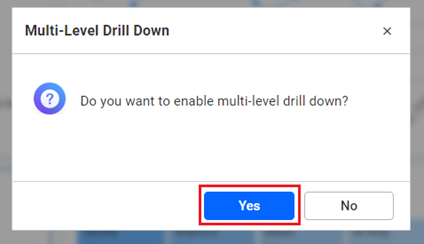
Dashboard Designer Page - Select Yes to enable multi-level drill down on the pop-up window.
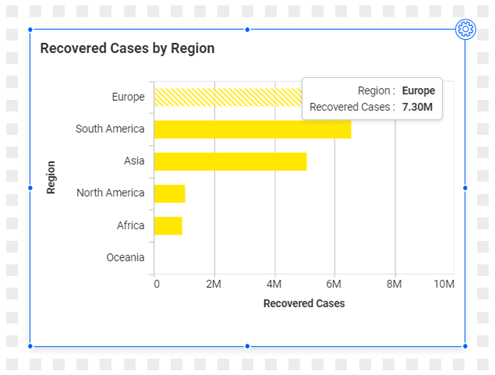
Multi-level drill down pop-up - Click the value you want to drill down in the chart:
Dashboard Designer Page - The chart will render the hierarchical data as shown below:
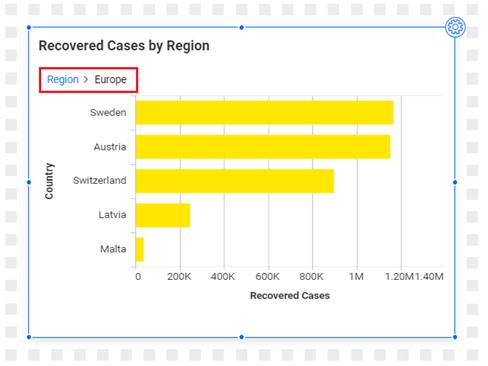
Dashboard Designer Page - To return to the previous view, click the highlighted text that indicates "drill up":
NOTE: Drill down feature is applicable to the below mentioned widgets:
- Bar chart
- Column Chart
- Stacked Column Chart
- Stacked Bar Chart
- 100% Stacked Bar Chart
- 100% Stacked Column chart
- Treemap
- Pivot Grid
- Map
- Bing map
- Heat Map
Related links
EO

