How to create dual axis chart in Bold BI
Published:
In Bold BI, you can create a dual axis chart in two ways. These two ways are:
- Using Chart type & Axis Settings in properties.
- Using Combo Chart or Combination Chart.
Using Chart type & Axis Settings in properties
The column chart allows you to compare values for a set of unordered items across categories through vertical bars ordered horizontally. Configure a column chart with two measures and change the series type to the column and line to achieve the dual axis chart.Follow these steps to create a dual axis chart:
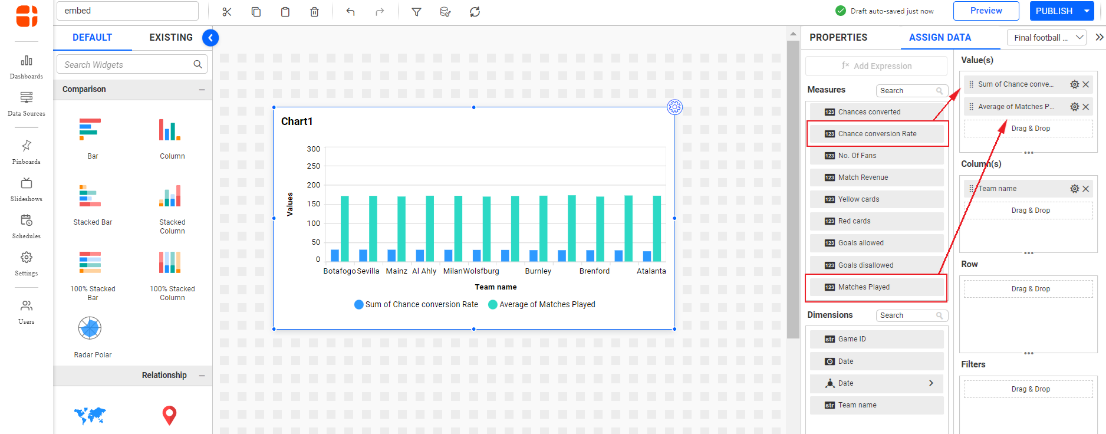
- Configure a column chart with at least two measures as follows.
Widget Configuration - Click on the PROPERTIES tab to navigate to the settings and customize the widget.
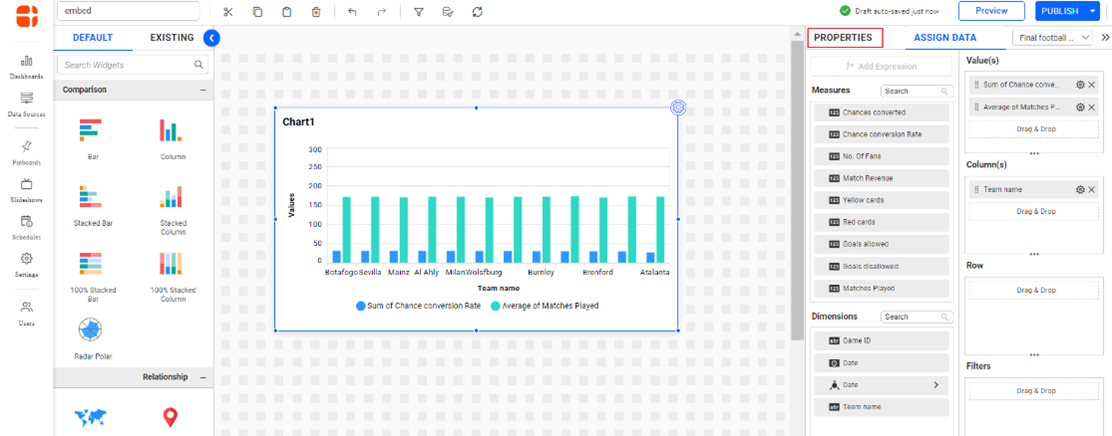
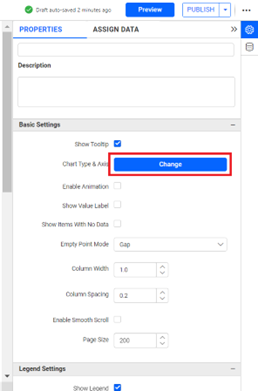
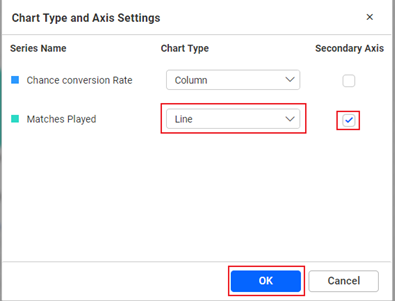
Chart Properties - Click Change in the Chart Type & Axis under the properties pane, and a Chart Type & Axis Settings pane pops up as follows.
Change chart type 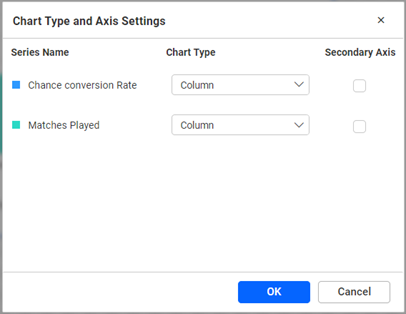
Change chart type - Change the column Chart Type to line, enable the secondary Axis option on the check box, then click OK.
Change chart type - The widget with a dual axis will be rendered as follows.
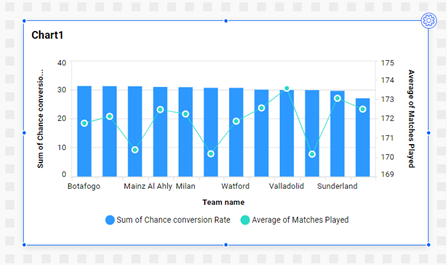
Chart with Dual Axis - Customize the widget to appear as follows.
The widget configured with a Dual Axis
Using a Combo Chart or Combination Chart
The Combination Chart allows you to compare values by combining multiple Cartesian charts (column, bar, stacked column, stacked bar, 100% stacked column, 100% stacked bar, spline, line, area, stacked area, and 100% stacked area). It also allows you to configure data to primary and secondary values separately, therefore, creating a dual-axis chart.Follow these steps to configure a combo chart.
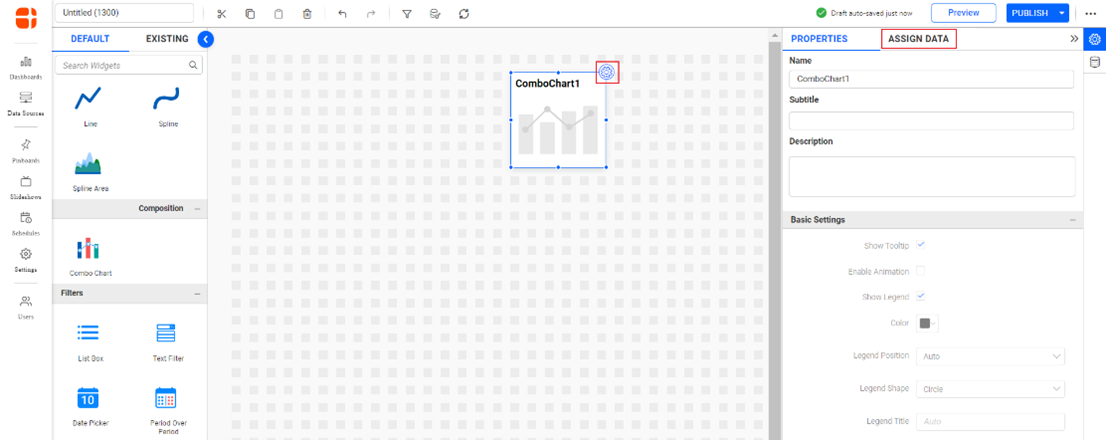
- Drag and drop a combo chart to the dashboard designer page.
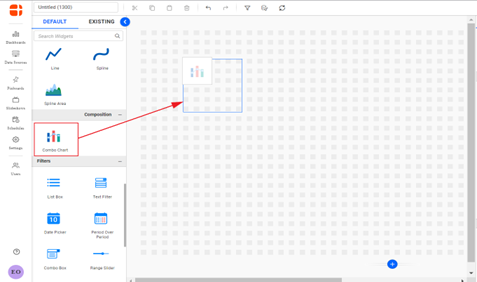
Dashboard Designer Page - Click Properties to open the property panel, then switch to the ASSIGN DATA
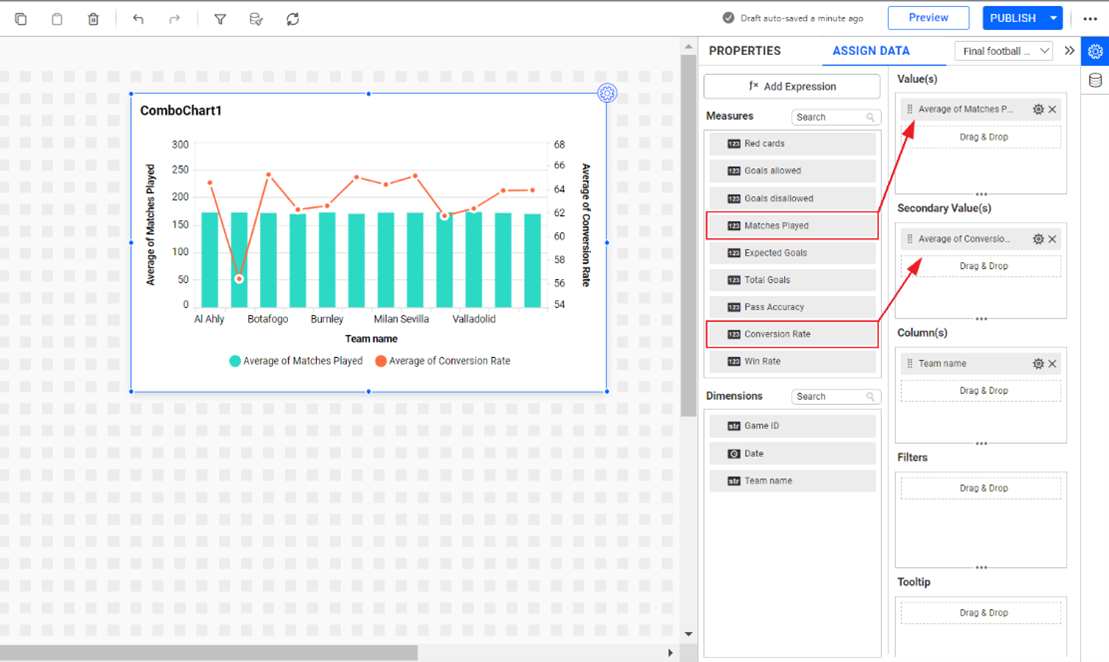
Widget Properties Panel - Configure the Primary and Secondary values to the column as follows.
Widget Configuration Panel - Click on the properties tab to navigate to the properties panel and apply basic settings to the widget.
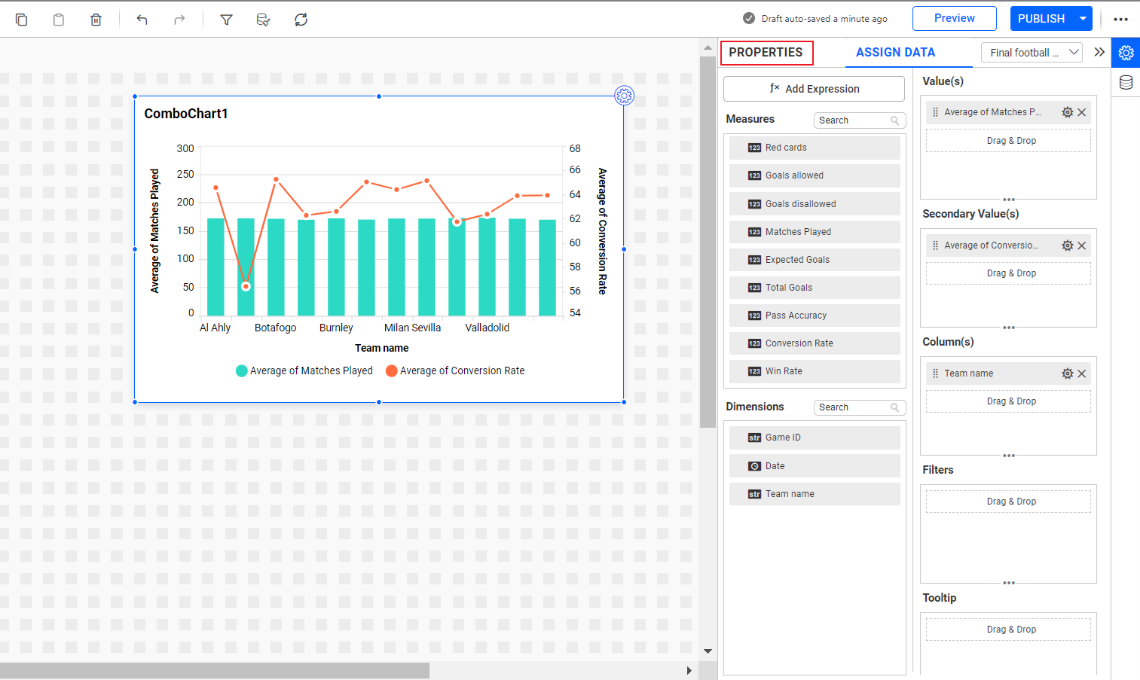
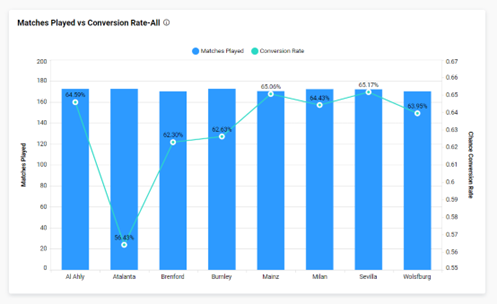
Widget Configuration Panel - The widget will be rendered as follows.
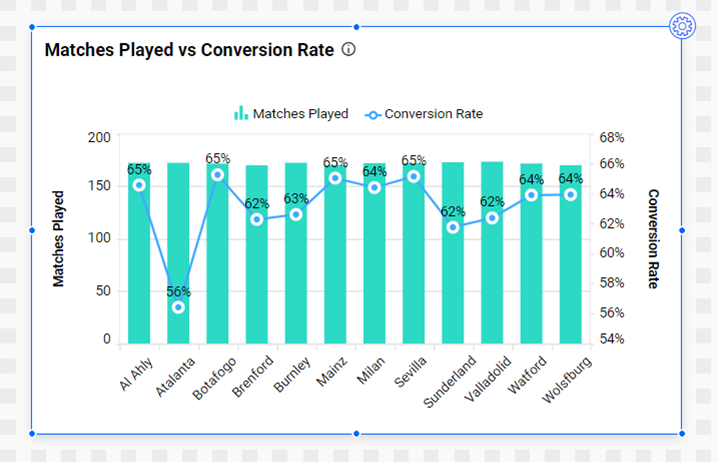
Configured Combo chart
Related links
EO

