How to Add a Range Slider Filter
Selecting the Range Slider Filter
If you are a Bold BI Cloud user, log in to your cloud site account. If you are an Embedded BI user, open the Bold BI application installed on your server.In this post, I am going to add a range slider filter to an area chart widget.
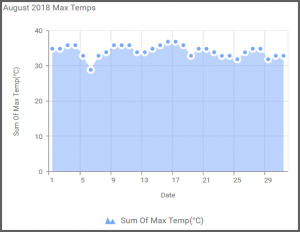
My area chart widget highlights the maximum temperature for each day of August 2018 (if you have not already done so, please feel free to read the post outlining how I created my area chart widget).
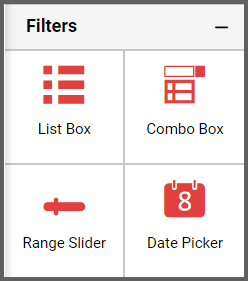
First, I need to drag the range slider filter from the “Filters” section of the widget menu onto my dashboard.
Assigning the Data and Customizing the Range Slider Filter
After I drag the range slider onto my dashboard, I need to rename it and assign data to it.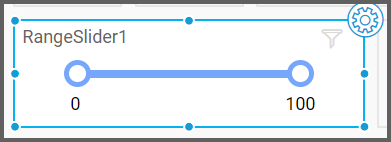
I would like my range slider to filter data by date, so I will click the “Settings” button in the upper right corner of the filter, click the “Properties” tab, and type “Select Date” into the range slider’s name field.
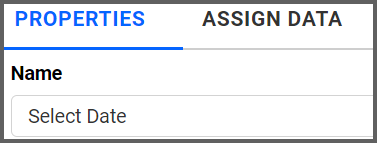
Next, I will click the “Assign Data” tab and will drag the “Date” field to the “Column” box.

The “Date” field sorts data by year by default, but I would like to be able to filter data by the individual days of the month. To update my filter, I need to click the “Options” button that appears beside the “Date” field and select “Date.”
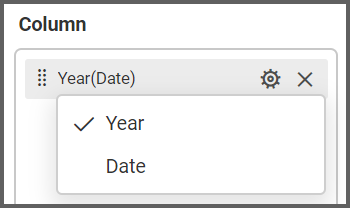

Now, my filter has been created. To test my filter’s functionality, I can click the “Preview” button in the upper right corner of my dashboard and navigate to the range slider.
I can select a date or date range by dragging the sliders. For example, if I want to see data for the second week of August, I can drag the sliders accordingly, and my widget will change its appearance.

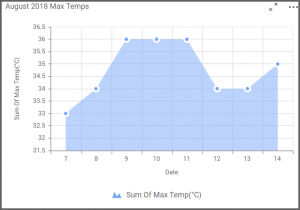
If I would like to clear the filter, I need only click the “Clear Master Filter” button that appears in the upper right corner of my range slider, and the widget will return to its original appearance.

