How to use LAG function in query to create dashboard?
Published:
Bold BI allows you to create the calculated fields using SQL queries such as Excel calculated fields. Calculated fields also known as Expression will also be used to create your dashboard in Bold BI.
Calculating percentage with the previous field
In Excel
To calculate percentage value by comparing the current month value with previous month value, you need to use the following formula in Excel sheet.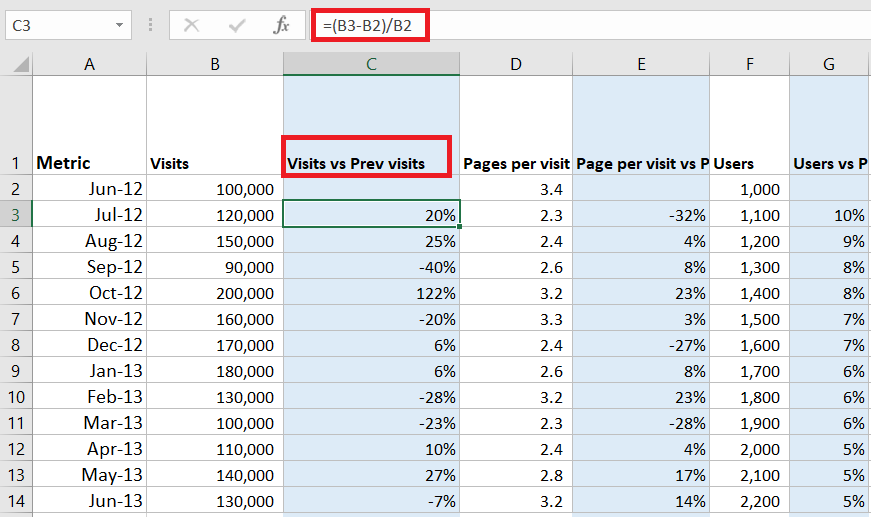
How to calculate LAG Function in Bold BI
Bold BI application uses an intermediate database to store your Excel data in the backend. So, it is possible for you to create a custom query for your dashboard which uses the Excel connection. Follow the below steps to recreate the pre-calculated KPIs of Excel in the Bold BI application.NOTE: We have supported intermediate databases such as SQL/Azure SQL, MySQL, and PostgreSQL.
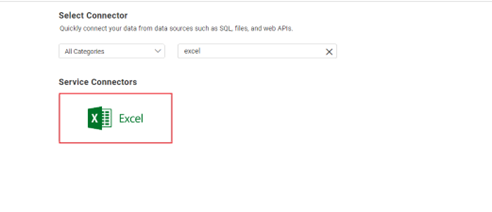
- Create an Excel data source. While connecting the data source, your Excel data will be extracted and created as a table in the Intermediate database which you have used in the Data Store Settings.
- Drag and drop your table in Design canvas and switch to Code View.
SELECT
       [Sheet1].[Metric],] AS [Metric],
       [Sheet1].[Visits],AS [Visits],
       [Sheet1].[Visits vs Prev Visits], AS [Visits vs Prev Visits]
       [Sheet1].[Pages per visit] AS [Pages per visit],
       [Sheet1].[Page per visit vs Prev page per visit] AS [Page per visit vs Prev page per visit],
       [Sheet1].[Users] AS [Users],
       [Sheet1].[Users vs prev users] AS [Users vs prev users],
       [Sheet1].[Comments] AS [Comments],
       [Sheet1].[Comments Vs Prev comments] AS [Comments Vs Prev comments],
       [Sheet1].[Total] AS [Total],
      [Sheet1].[Total vs Prev total] AS [Total vs Prev total],
      [Sheet1].[Search engines] as [Search engines]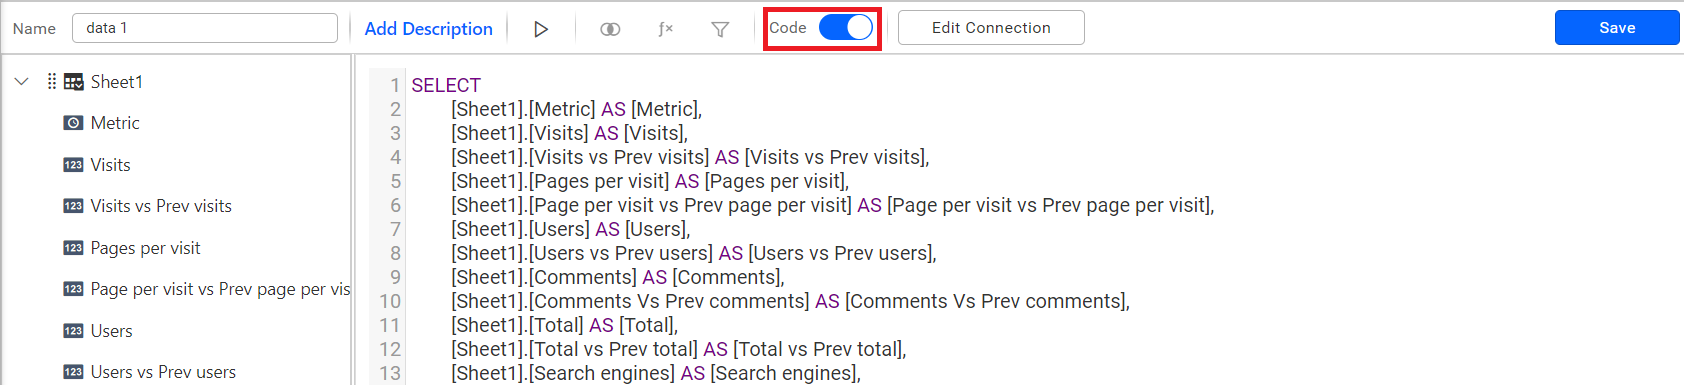
- Use LAG analytic function to access the data from the previous row and add it as a virtual column using the queries as follows:
- SQL:
SELECT
[Sheet1].[Metric],] AS [Metric],
[Sheet1].[Visits],AS [Visits],
LAG([Sheet1].[Visits], 1,null) over (order by [sheet1].[Metric] as Prevvisits,
[Sheet1].[Pages per visit] AS [Pages per visit],
LAG([Sheet1].[Pages per visit], 1,null over (order by [sheet1].[Metric] as [PrevPagesPerVisit],
[Sheet1].[Users] AS [Users],
LAG([Sheet1].[Users], 1,null over (order by [sheet1].[Metric] as [PrevUsers],
[Sheet1].[Comments] AS [Comments],
LAG([Sheet1].[Comments], 1,null over (order by [sheet1].[Metric] as [PrevComments],
[Sheet1].[Total] AS [Total],
LAG([Sheet1].[Total] 1,null over (order by [sheet1].[Metric] as [PrevTotal],
[Sheet1].[Search engines] AS [Search engines],
[Sheet1].[Referring sites] AS [Referring sites],
[Sheet1].[Direct] AS [Direct],
[Sheet1].[Other] AS [Other],
[Sheet1].[Desktop] AS [Desktop],
LAG([Sheet1].[Desktop] 1,null over (order by [sheet1].[Metric] as [PrevDesktop],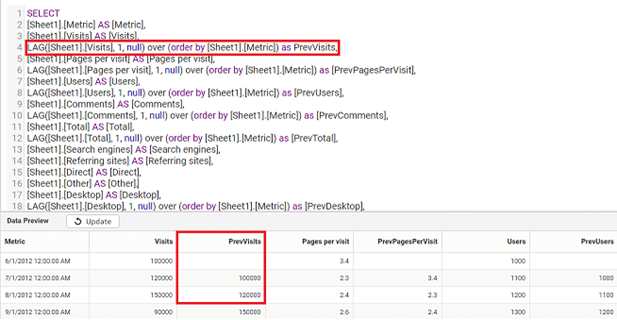
- MySQL:
SELECT
       ‘Sheet1’.’48f140d2=005e-4585-ac38-783123b9c45a’ AS ‘ Metric’
       ‘Sheet1’.’1e9952a6-cof4-4ab6-b4da-43c3c587e79a’ AS ‘ Visits’
       LAG(‘Sheet1’.’1e9952a6-cof4-4ab6-b4da-43c3c587e79a’,1,null) over (order by ‘sheet1’. ‘48f140d2=005e-4585-ac38-783123b9c45a’) as ‘PrevVisits’,’Sheet1’,’effc9b10-6259-4529-8139-4d0de4220f52’ AS ‘ Pages per visit’,
       LAG(‘Sheet1’.’effc9b10-6259-4529-8139-4d0de4220f52’,1,null) over (order by ‘sheet1’. ‘48f140d2=005e-4585-ac38-783123b9c45a’) as  ‘PrevPagesPerVisit’,’Sheet1’,’02959d00-8072-44f2-97a5-0c99b6a9b367’ AS ‘Users’,
       LAG(‘Sheet1’.’02959d00-8072-44f2-97a5-0c99b6a9b367’,1,null) over (order by ‘sheet1’. ‘48f140d2=005e-4585-ac38-783123b9c45a’) as   ‘PrevUsers’
FROM ‘Datasource_ba0286b2-313-4e02-bcdc-f497df462a19’.’Sheet1’ AS ‘Sheet1’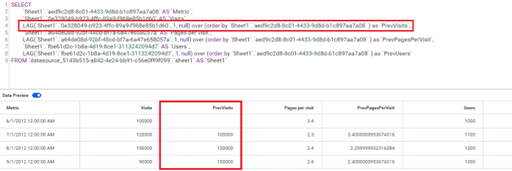
- PostgreSQL:
SELECT
       “Sheet1”.”48f140d2=005e-4585-ac38-783123b9c45a” AS “ Metric”
       “Sheet1”.”1e9952a6-cof4-4ab6-b4da-43c3c587e79a” AS“ Visits”
       LAG(“Sheet1”.”1e9952a6-cof4-4ab6-b4da-43c3c587e79a”,1,null) over (order by “sheet1”. “48f140d2=005e-4585-ac38-783123b9c45a”) as “PrevVisits”,”Sheet1”,”effc9b10-6259-4529-8139-4d0de4220f52” AS “ Pages per visit”,
       LAG(“Sheet1”.”effc9b10-6259-4529-8139-4d0de4220f52”,1,null) over (order by “sheet1”. “48f140d2=005e-4585-ac38-783123b9c45a”) as  “PrevPagesPerVisit”,”Sheet1”,”02959d00-8072-44f2-97a5-0c99b6a9b367” AS “Users”,
       LAG(“Sheet1”.”02959d00-8072-44f2-97a5-0c99b6a9b367”,1,null) over (order by “sheet1”. “48f140d2=005e-4585-ac38-783123b9c45a”) as   “PrevUsers”
FROM “Datasource_ba0286b2-313-4e02-bcdc-f497df462a19”.”Sheet1” AS “Sheet1”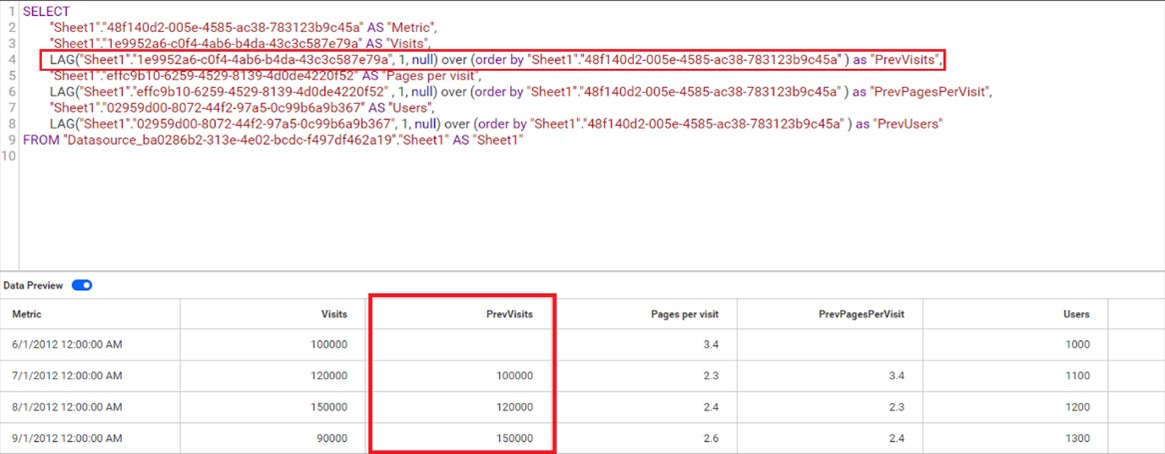
- Configure the added virtual column in widgets as follows.
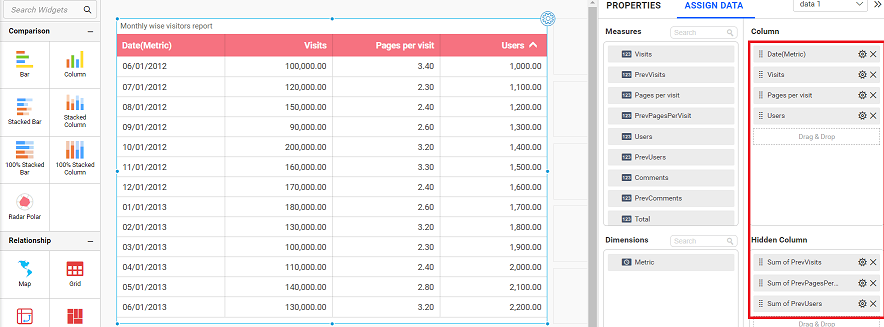
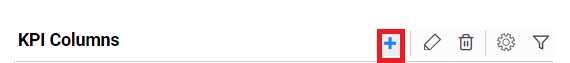
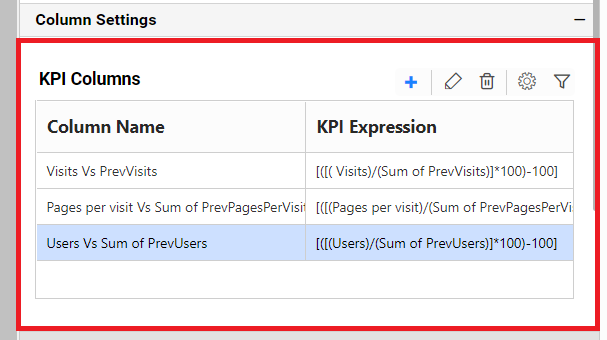
- Go to the Properties tab of the Grid widget and added KPI columns to show the computed values. Click Add button under Columns Settings to add the KPI columns to your widgets.
- Add the KPI Expression as follows.
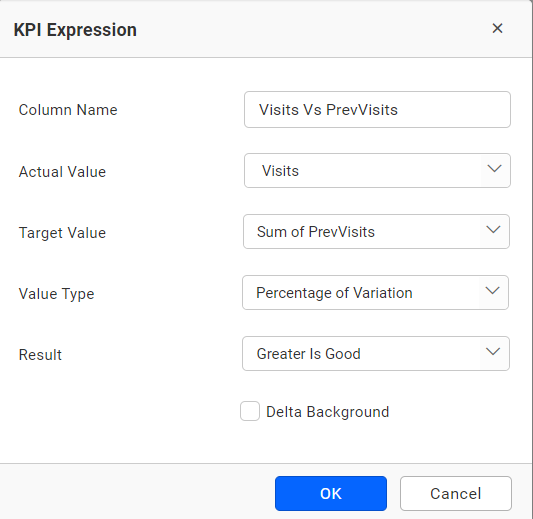
- You can add N number of KPI Expression column by clicking Add button.
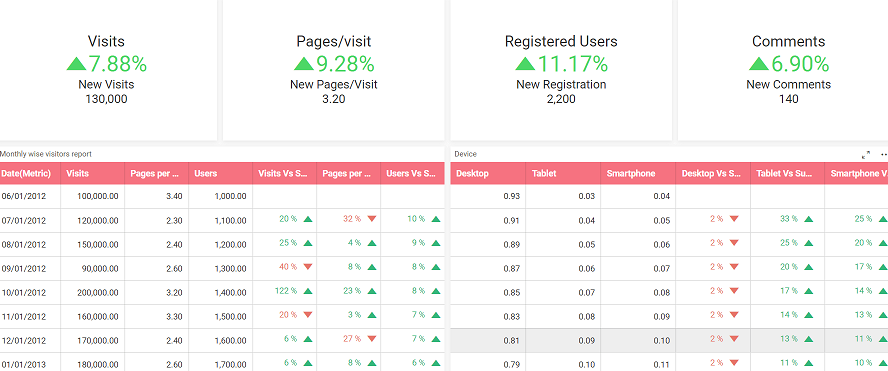
- The following grid widget is the sample widget which shows the comparison of the current month and previous month values in percentage, and they are equivalent to the Excel data.

- You can also configure more widgets to show overall percentage of a column, the number of new visits count, page visits, new users count, new comments count, and more to create your dashboard.
- SQL:
Related links
RN

