How to transform excel rows to columns & use in dashboard?
In the Bold BI application, users can use the PostgreSQL crosstab function to convert row data into columns and then bind the data to widgets. There is no direct option to bind a specific cell value from a Google sheet or Excel as a column name. Because when you connect the file data source in Bold BI, the data from the file gets extracted and moved to an intermediate SQL database. Later, the query is issued to the PostgreSQL server to process every dashboard interaction.
NOTE: In Bold BI, we have support for an intermediate database such as MySQL, PostgreSQL, and SQL, but the crosstab function to convert row data into columns is only supported on PostgreSQL databases.
How to change row data to a column using the PostgreSQL crosstab function
The following excel sheet with sample data explains how to change row data to the column using the PostgreSQL crosstab function.
The following steps explain how to change row data to the column using the PostgreSQL crosstab function:
- We need to enable the crosstab function. The crosstab function is part of the PostgreSQL extension called tablefunc. Execute the following query in PostgreSQL to enable the tablfunc module for the configured database.
create extension tablefunc; - Use the following custom PostgreSQL query in code view to convert row to column.
SELECT "Month", "Target"::int, "Profit"::int FROM (
SELECT * FROM crosstab(
$ct$ SELECT u.attnum, t.rn, u.val FROM  (
SELECT row_number() OVER () AS rn, * FROM "Datasource_862ecc48-c089-4aee-b760-70c5594dbbd5"."Sheet1") t
, unnest(ARRAY["bcfe34e9-eead-4054-90c3-df815baddedd"::text,
             "6c0cfeec-cf5f-9ac0-a895fd44b887"::text,
             "b51b3937-1c84-4c96-b737-ed751d21ea01"::text,
              "151b20bf-045b-4a96-bcc9-72cfeafb623"::text,
              "5abddaf8-1a9f-49997-8b5f-ee13ad6ac97d"::text,
              "5abddaf8-1a9f-49997-8b5f-ee13ad6ac97d "::text,
              "6559cbed-ca5e-4f10-a386-cea6-1b48a36"::text ]) WITH ORDINALITY u(val, attnum)
ORDER  BY 1,2$ct$
) t(attnum bigint,"Month" text,"Target" text,
"Profit" text))t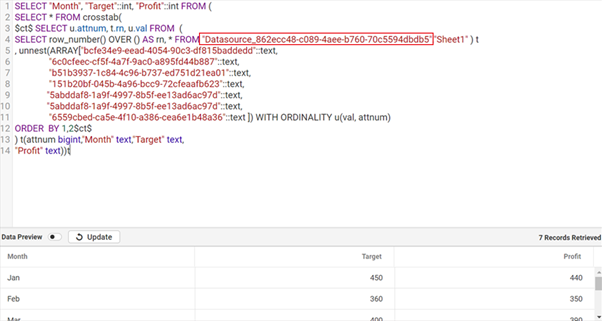
NOTE: Replace column names (Column2, Column3, etc…) and database schema name according to your data source… In the above query above, the database schema name is highlighted.
- To get the database schema name, drag and drop the table (extracted Excel data stored in PostgreSQL table) in the design canvas.
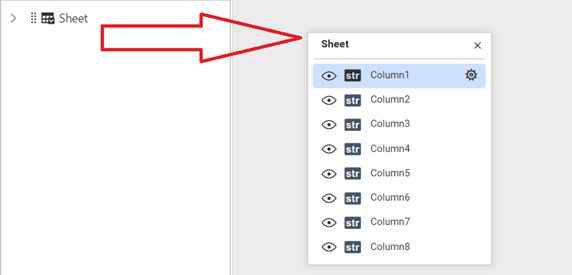
- Switch to code to get the schema and table names.
SELECT
   [Sheet].[Column1]AS [Column1],
   [Sheet].[Column2]AS [Column2],
   [Sheet].[Column3]AS [Column3],
   [Sheet].[Column4]AS [Column4],
   [Sheet].[Column5]AS [Column5],
   [Sheet].[Column6]AS [Column6],
   [Sheet].[Column7]AS [Column7],
   [Sheet].[Column8]AS [Column8],
FROM [Datasource_3e296336-ea19-472d-a175-a2f37a91e381].[Sheet] AS [Sheet]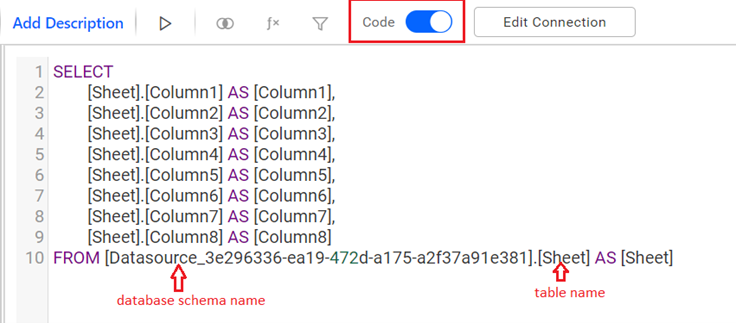
- After getting the database schema name, use it in the PostgreSQL crosstab query and run it to see the result in the preview panel.
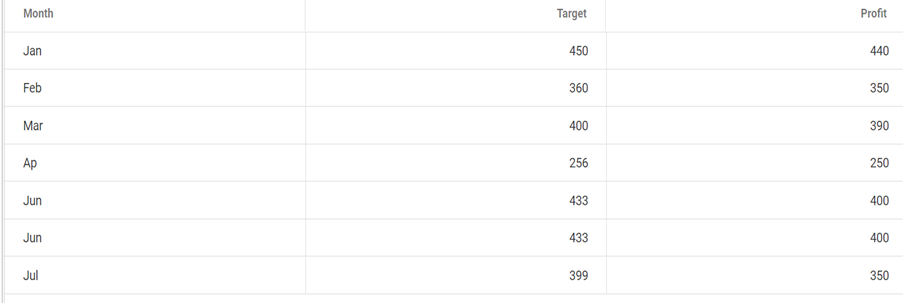
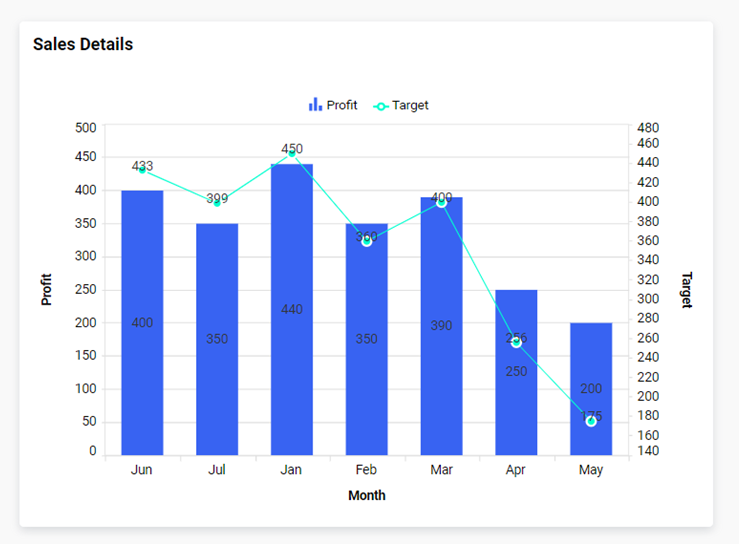
- Use the column to configure widgets to the dashboard.
Related links
